Private REITs Have Outperformed Canadian Preferred Shares for 20+ Years
Preferred shares are company stock with dividends that are paid out before common stock dividends are paid – they are generally viewed as relatively safe investments for risk-averse investors. Interested investors have traditionally looked to preferred shares with the aim of increasing their equity yield, generating an income stream, and reducing the overall volatility of their portfolio. However, if we consider private multi-residential apartments, we can see they are an attractive alternative to Preferred Shares.
In fact, when you compare Preferred Shares and Private REITs, private multi-residential apartments can offer investors a much more compelling way to gain the same important investment outcomes — with the bonus of generating income in a more tax efficient way.
We will discuss five ways Private Multi-Residential Apartments have outperformed preferred shares:†
- Higher total returns
- Lower volatility and higher risk-adjusted returns
- Better downside protection
- Real diversification
More tax efficient
† Historical returns may not be indicative of future performance.
We can do our comparison over the past 22 years – 2003 being the first full year for the S&P/TSX Preferred Total Return Index.
Higher total returns
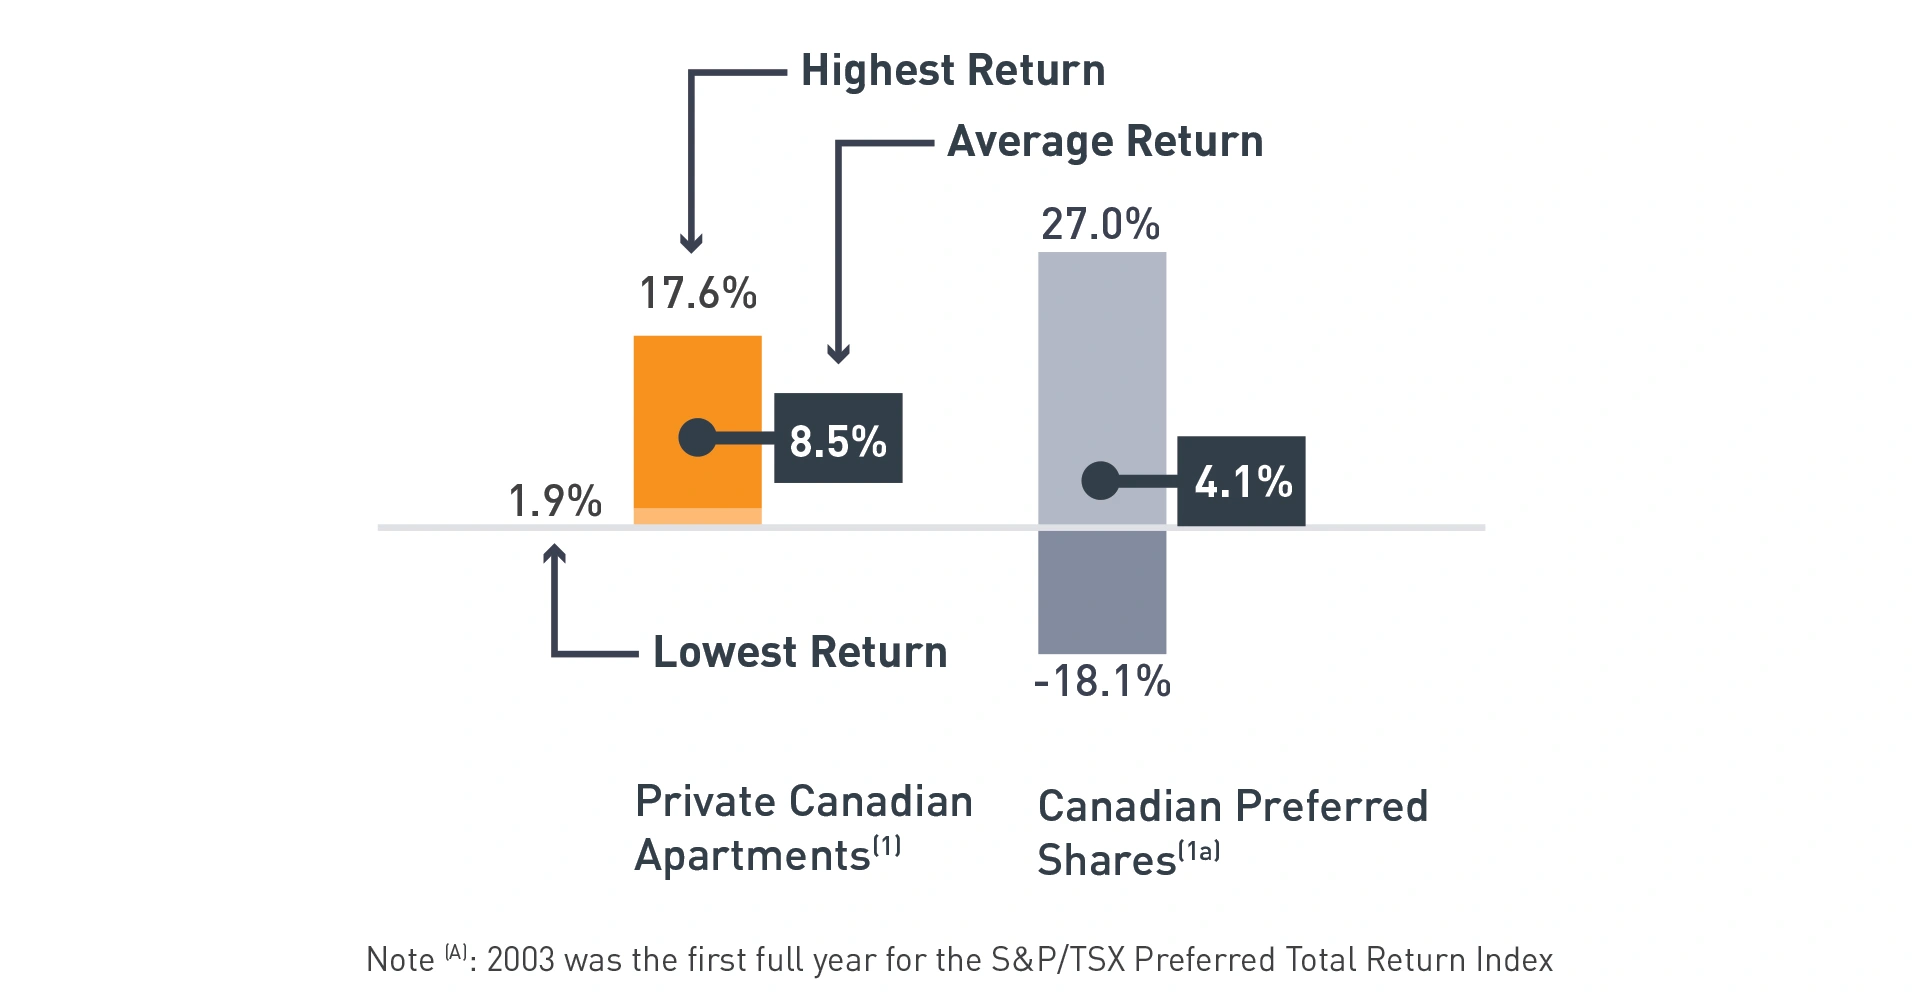
If we look at the past two decades[A], the average annual return for Private Apartments was 8.5%, which is 107% higher than the 4.1% recorded for Canadian Preferred Shares.
Over this same time, the lowest return on Private Apartments was 1.9% while the lowest return for Preferred Shares was a negative 18.1%.
Lower volatility and higher risk- adjusted returns
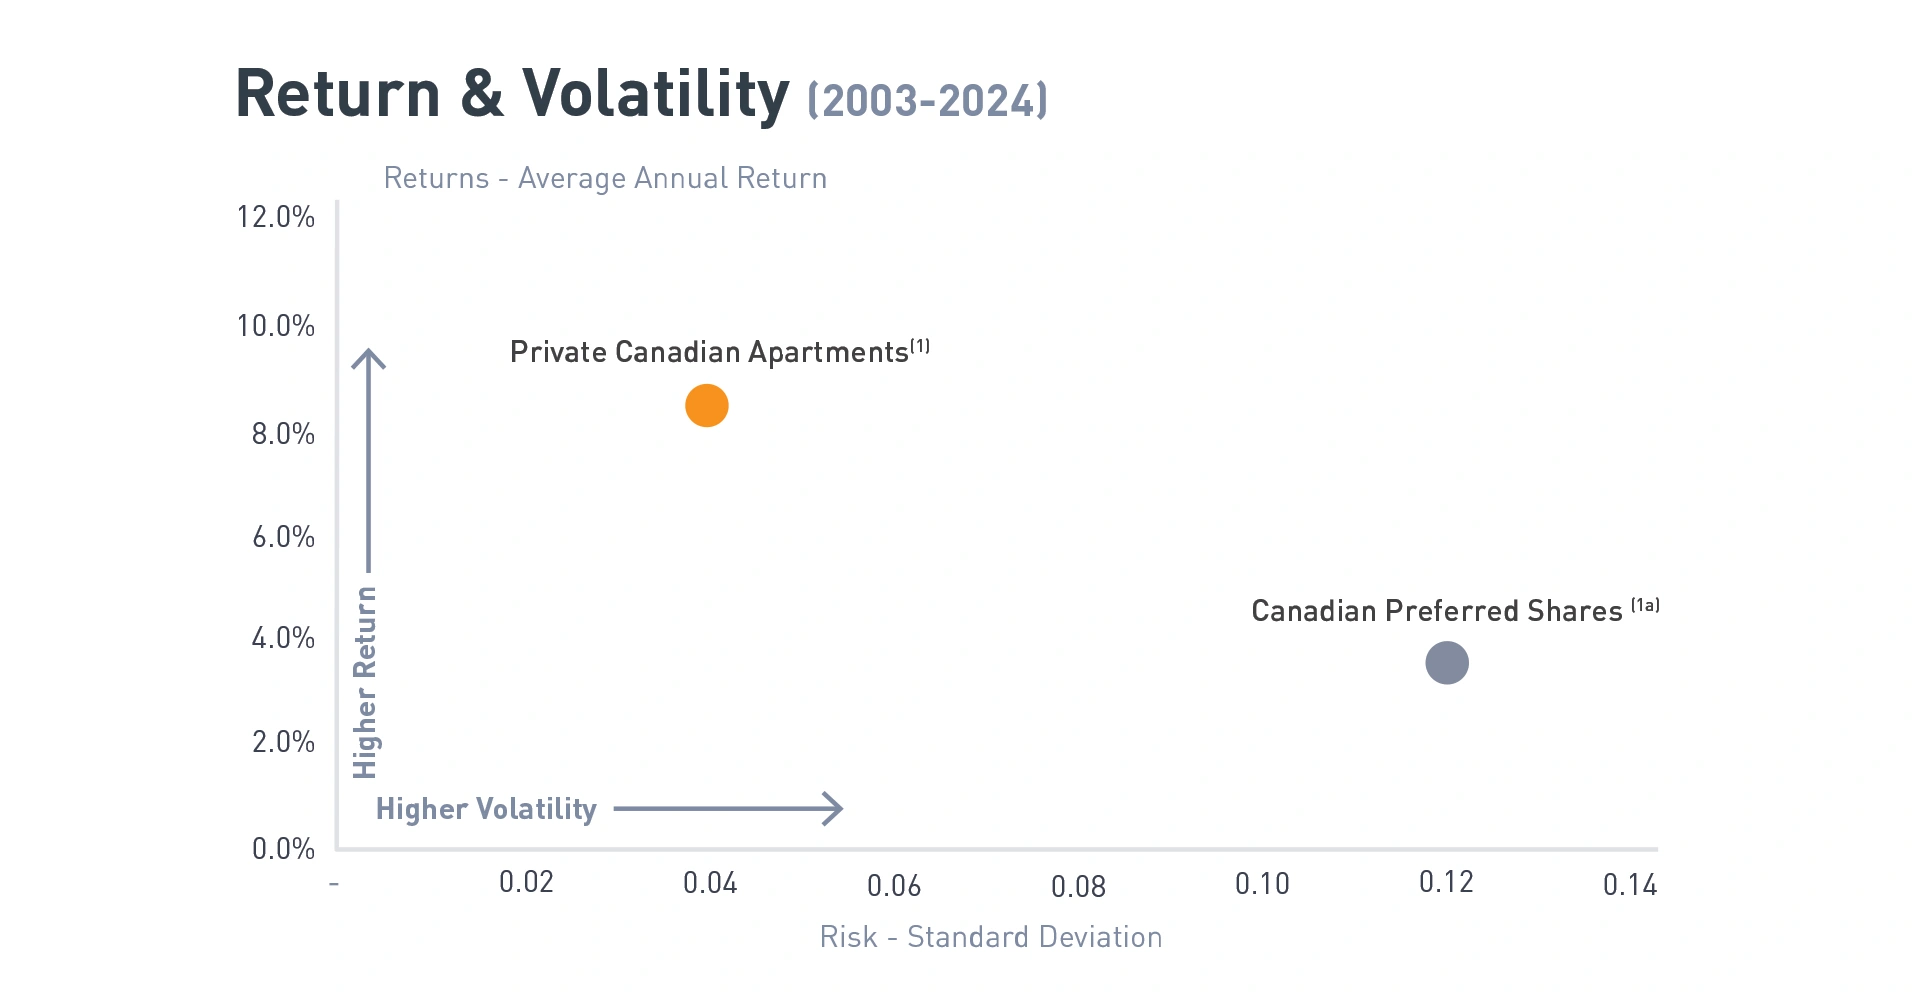
Not only have Private Canadian Apartments performed better than Canadian Preferred Shares over the past two decades; they have also been significantly less volatile and provided a much higher risk adjusted return.
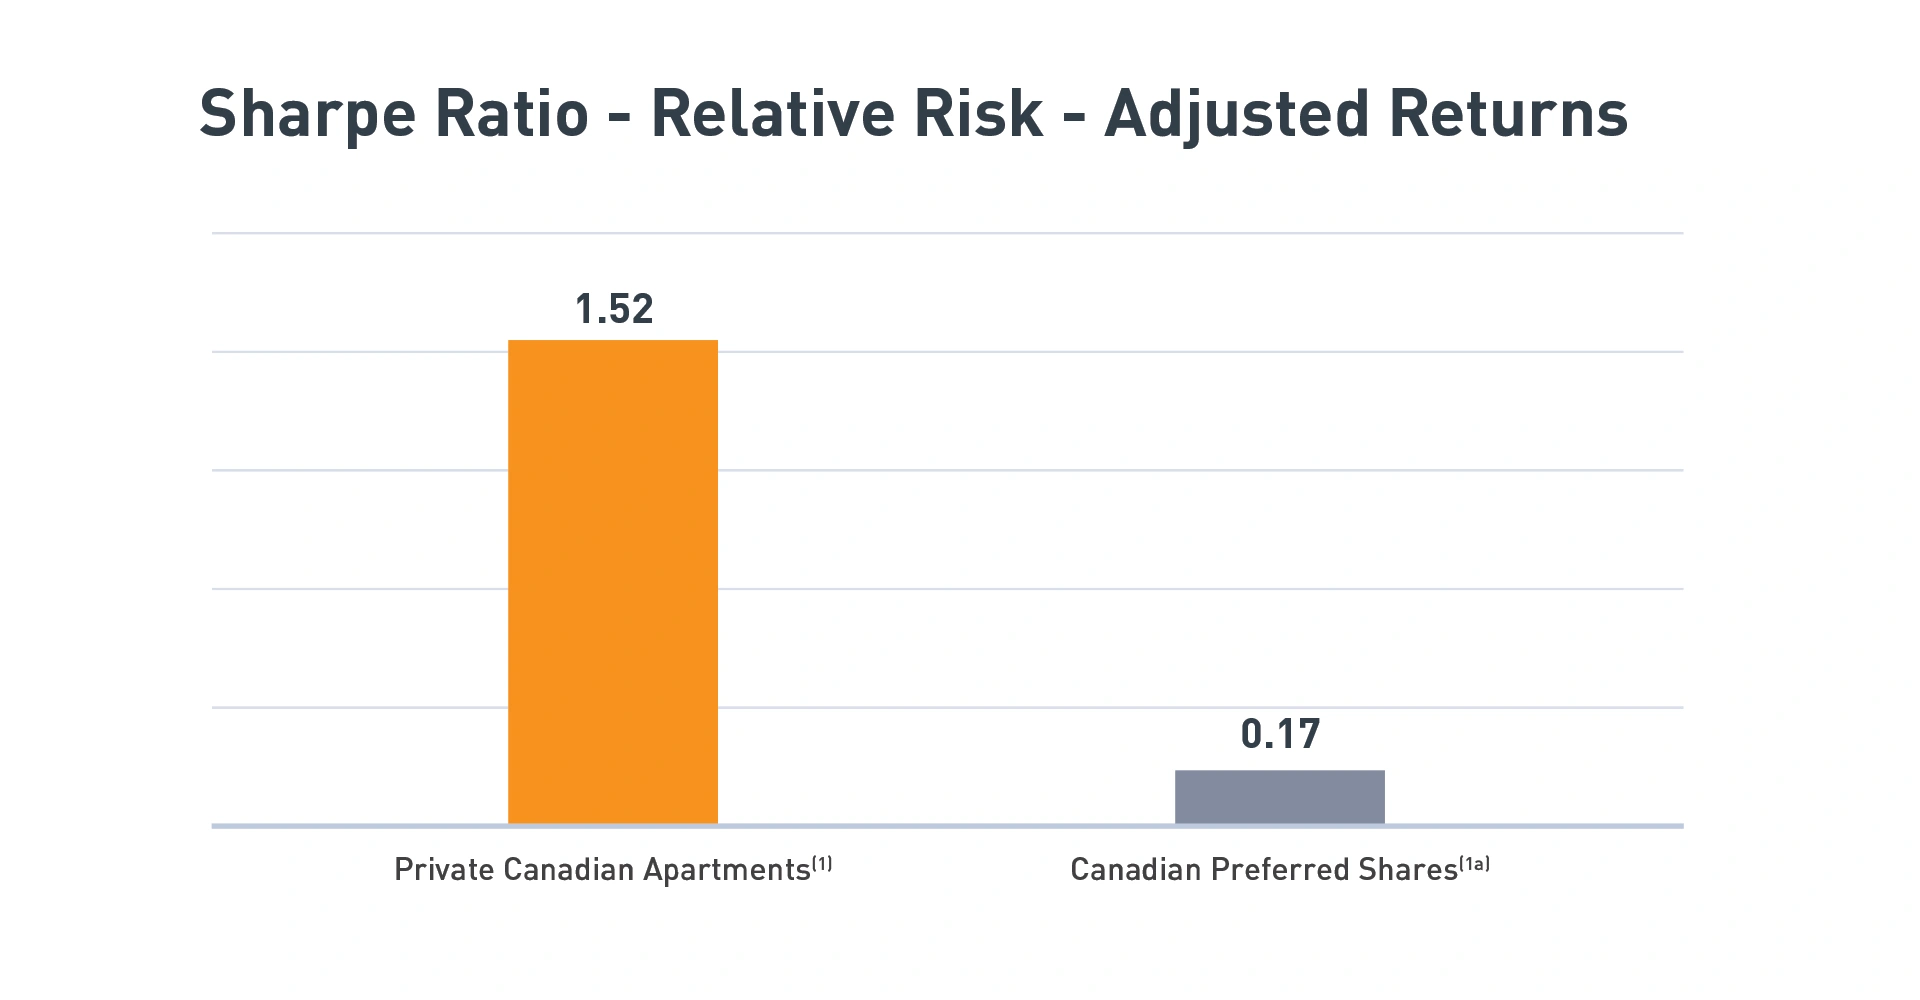
The Sharpe Ratio is widely accepted as the best way to compare the relative risk-adjusted returns across various investments — the higher the Sharpe Ratio, the better the investment’s historical risk-adjusted performance. As we see in the chart below, the risk adjusted return on Private Canadian Apartments was meaningfully higher than Canadian Preferred Shares Market Equities over the past 22 years.
Better downside protection
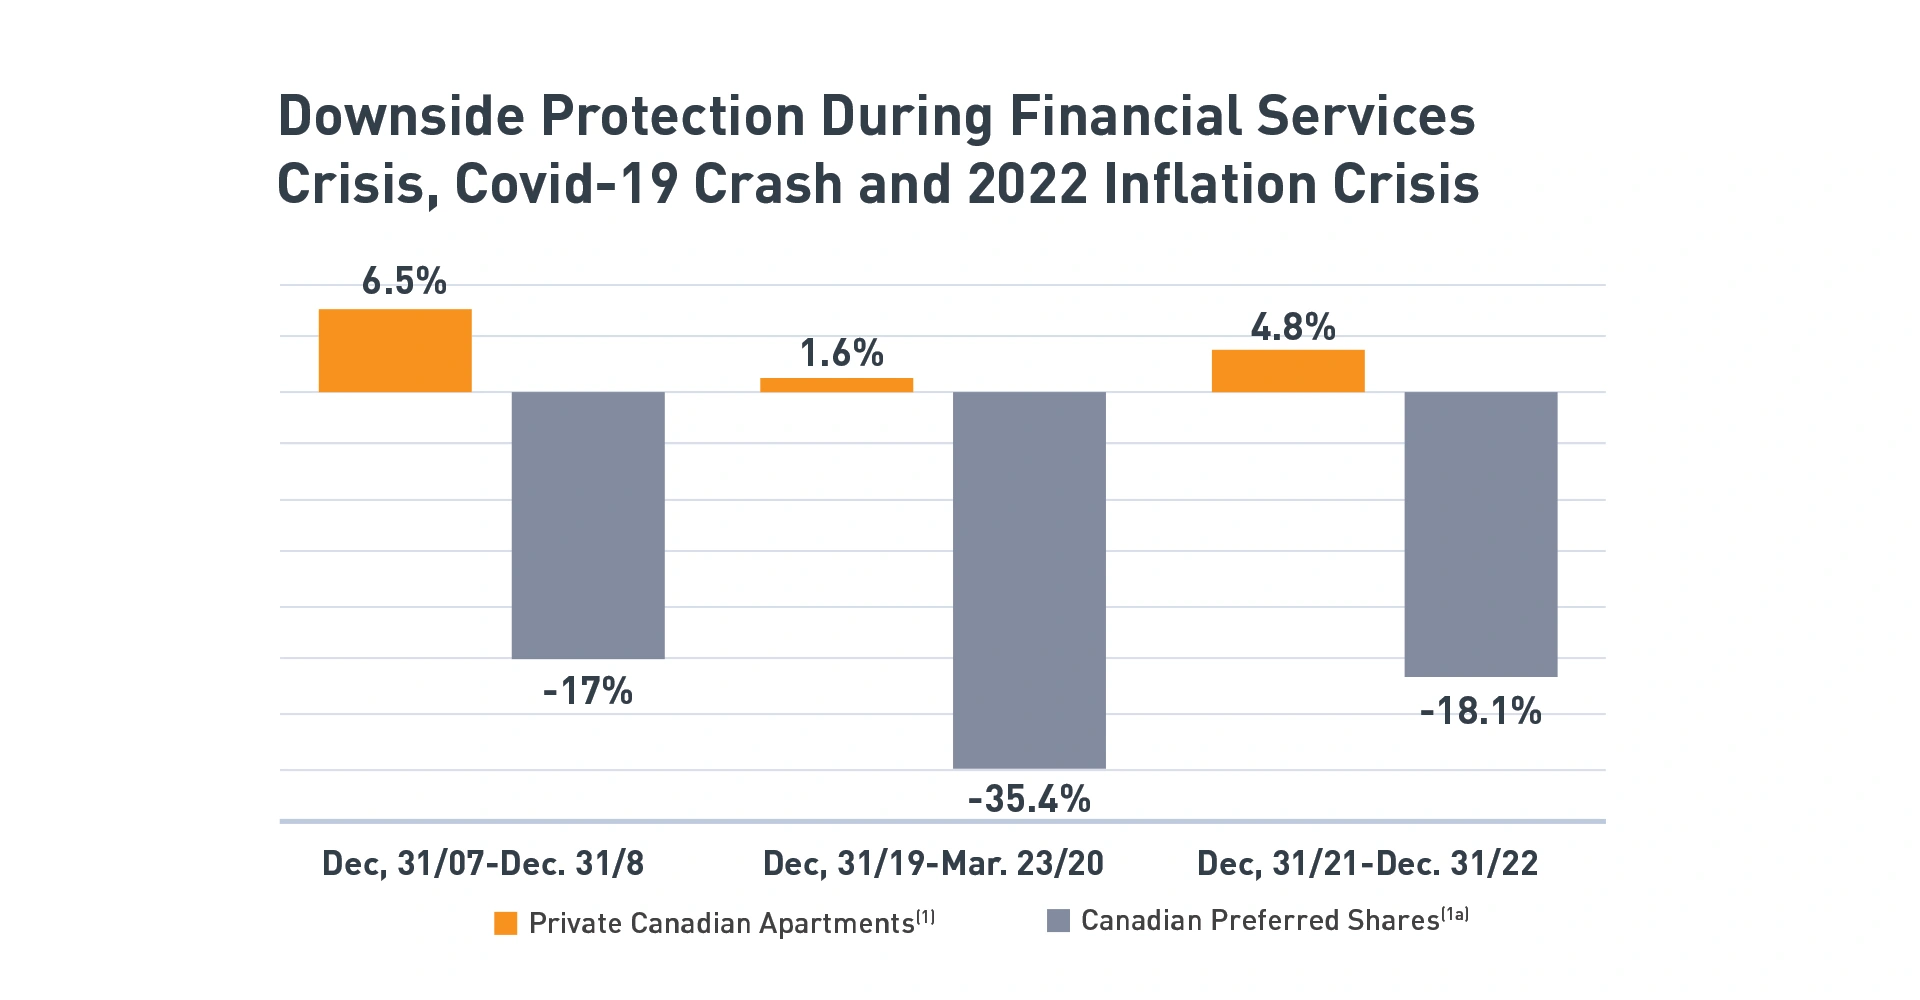
Knowledgeable investors look for places to put their money where it will have more protection from disruptions like financial crises and market upheaval. Of course, we cannot predict future shocks, but we can look to history as a guide. Over the last 22 years, Private Canadian Apartments have provided investors with significant downside protection. Over this period, Private Canadian Apartments have never had a negative annual return, while in contrast, Canadian Preferred Shares experienced negative annual returns 27% of the time.

Over the past two decades, there are three tumultuous periods we can examine to compare how our two investment options weathered the storms. During the 2008 Financial Crisis, the Covid-19 Crisis, and the 2022 Inflation Crisis, Private Canadian Apartments posted a return of 6.5%, 1.6%, and 4.8%, respectively. In stark contrast, Canadian Preferred Shares experienced substantial negative returns during these times.
Real diversification
Diversification is a crucial part of a balanced investment portfolio because it can, as we know, help to mitigate overall risk. Investors looking to add diversification can find it with Private Canadian Apartments. REITs have historically had negligible correlation to other kinds of investments. In other words, they tend not to move with assets including Canadian Bonds, or Canadian, Global, Emerging Market, and US Equities. On the other hand, Canadian Preferred Shares are significantly correlated to Canadian Equities and other asset classes. An investor can enhance diversification in their portfolio by adding Private Canadian Apartments even if they already hold Preferred Shares since the two asset classes are, themselves, negatively correlated – they tend to move in opposite directions.
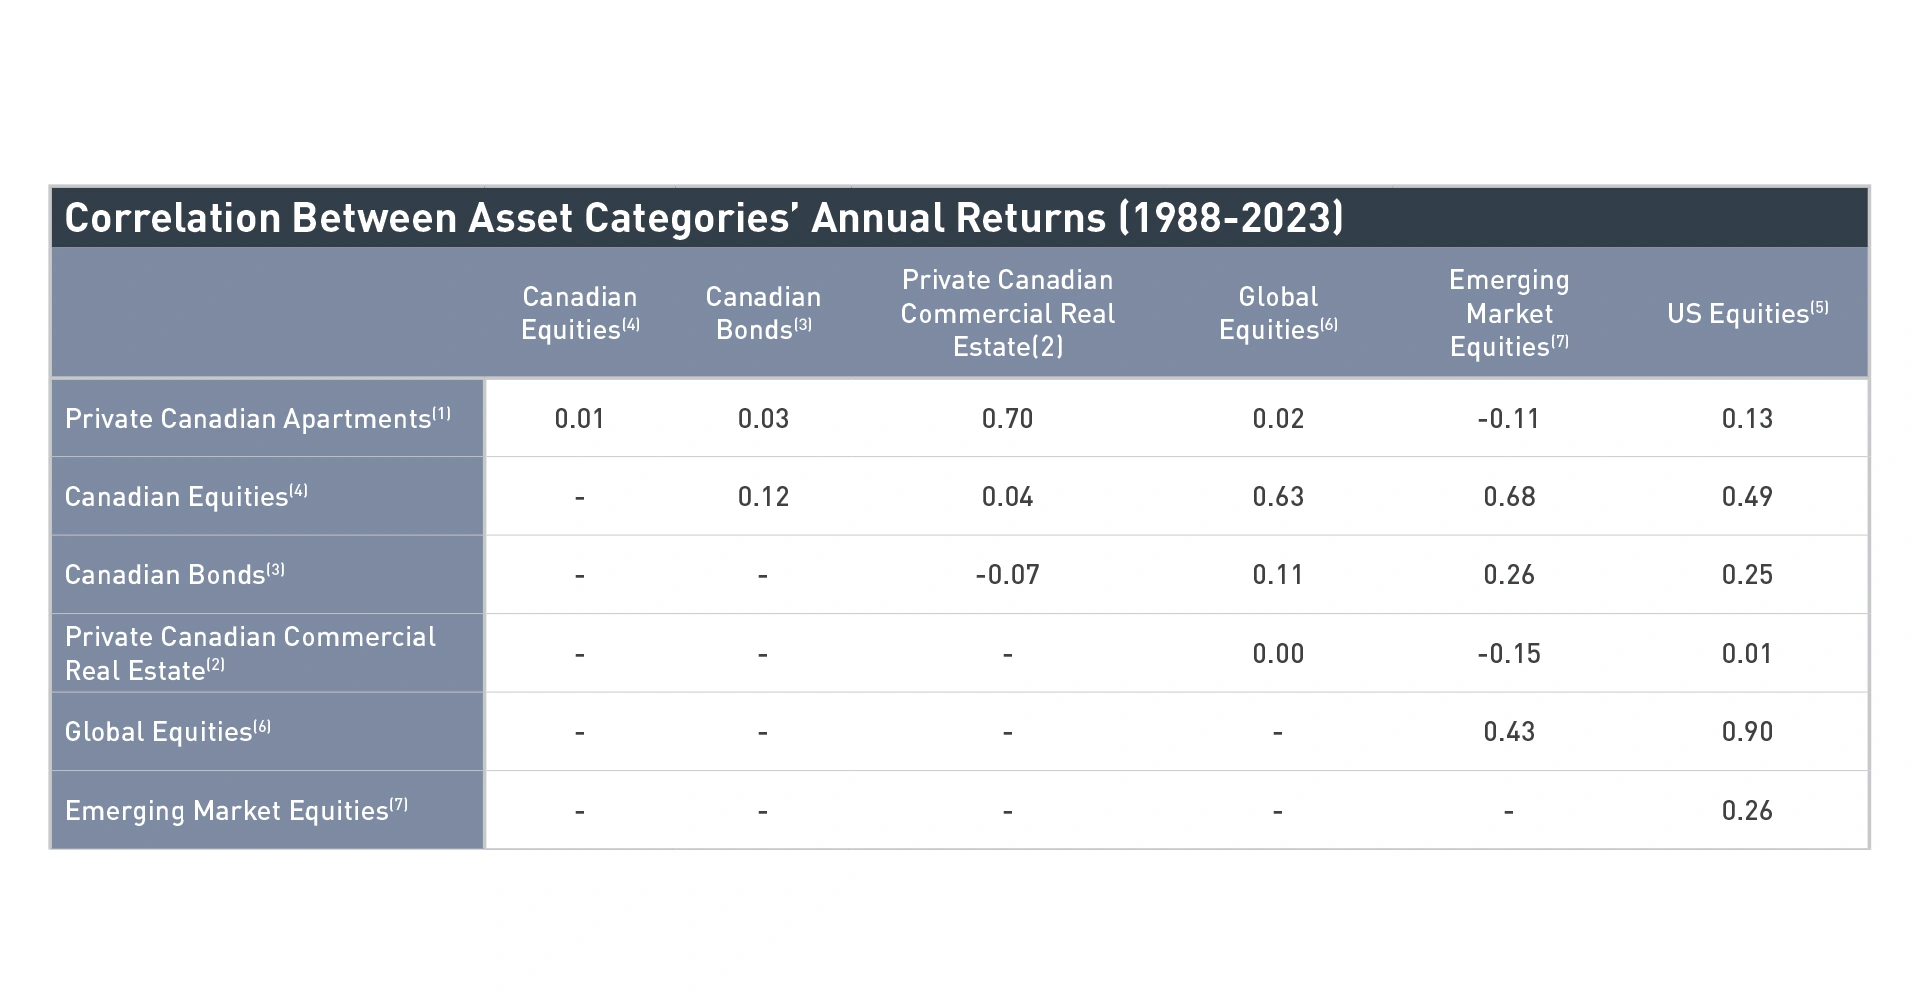
Note: A value closer to 1 means a relatively high positive correlation – the assets move in the same direction. A value closer to –1 means a negative correlation – they move in opposite directions. A value closer to zero means a relatively weaker correlation between the assets.
More tax efficient
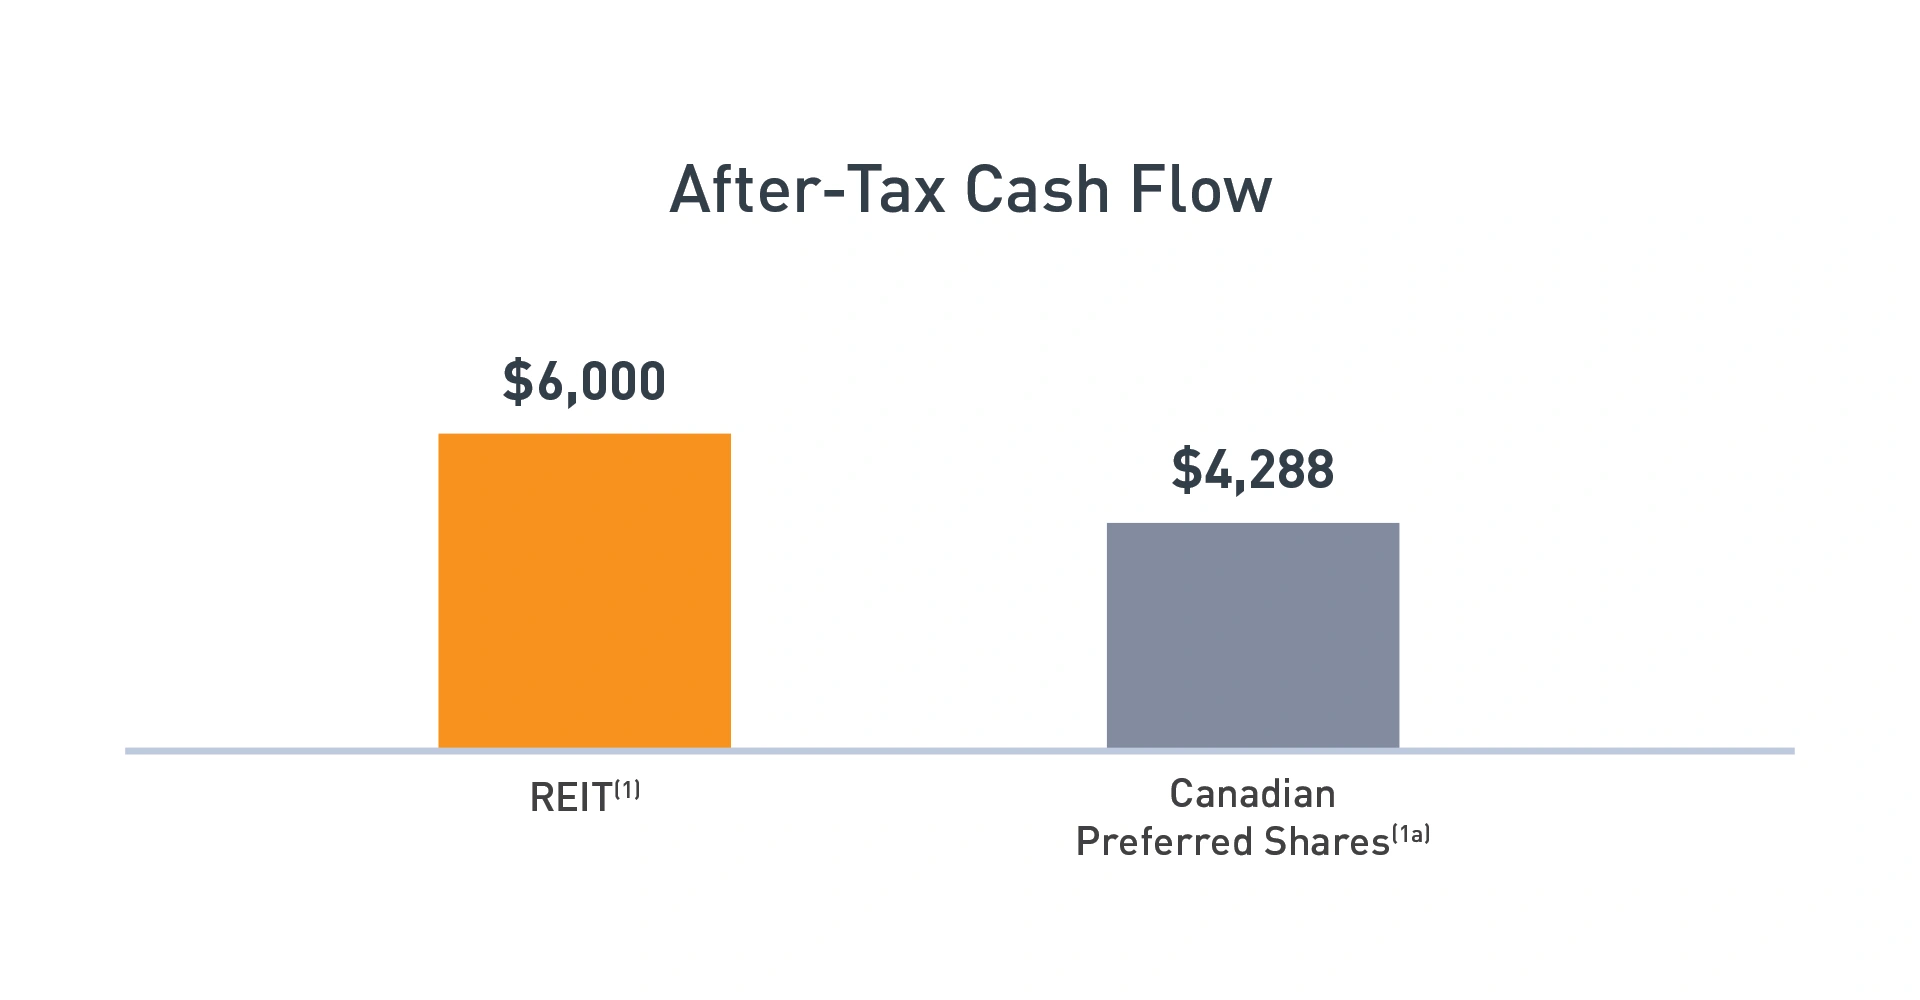
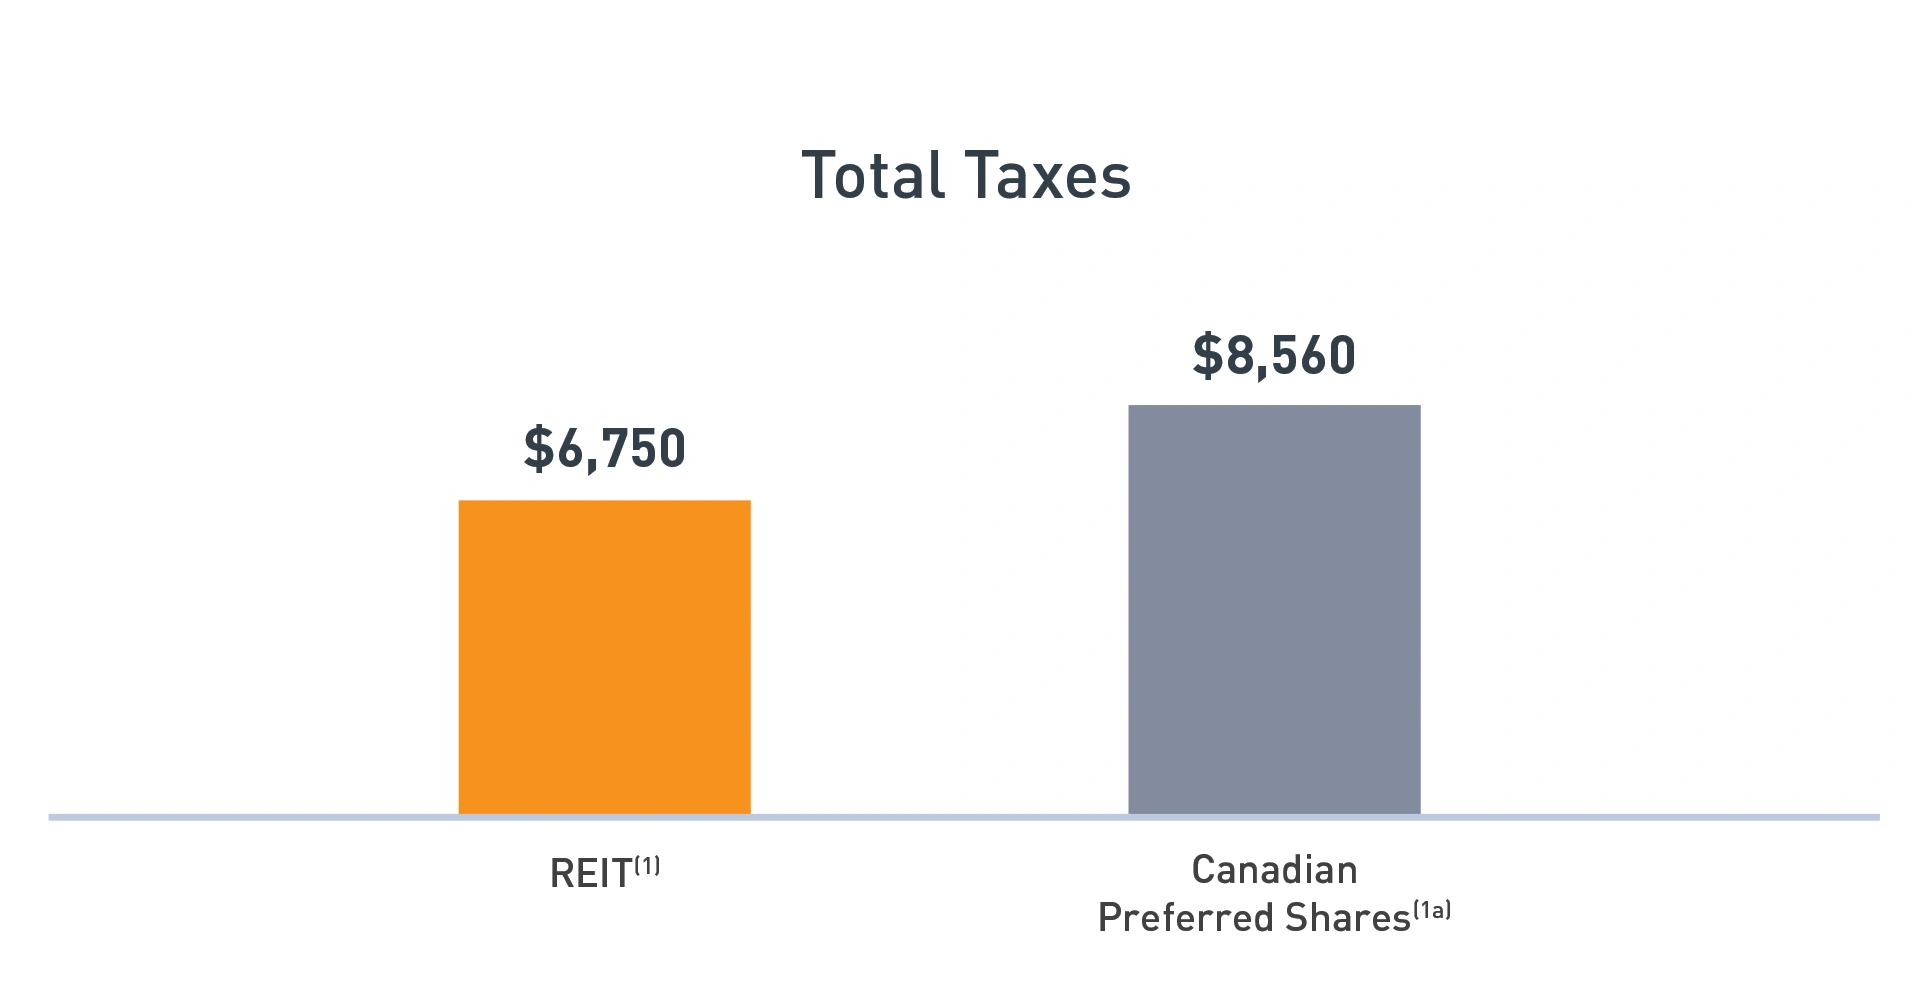
Dividends received from preferred shares are relatively more tax efficient than interest income. However, they may be significantly less tax efficient than distributions received from a Private Apartment REIT. Let’s look at an example and compare after-tax cashflow, total taxes, and the amount of capital required in each case. We will compare a five-year investment in preferred shares with a 6% yield to an investment in a Private Apartment REIT with a 6% distribution.
Higher after-tax cashflow
The preferred share investor would receive $6,000 in preferred dividends each year and would have to pay approximately $1,712 in taxes each year. In contrast, the REIT investor may not be required to pay any taxes in the current year and may be able to defer paying any tax until the REIT is sold.
Lower total taxes
Total taxes paid over five years on the preferred shares would be $8,560. Taxes on the REIT would only be $6,750 and the REIT taxes could potentially be deferred until it is sold.
Tie up less capital
From an after-tax perspective, an investor would have to invest $139,929 in a 6% yielding preferred share to generate a $500 a month after-tax income stream. In contrast, an investor would only have to invest $100,000 in a 6% yielding tax efficient REIT to generate the same $500 a month after-tax income stream.

In these five areas, across two decades, Canadian Private REITs have outperformed Canadian Preferred Shares. Investors can look to these REITs as smart, sensible, and rewarding additions to their portfolios.
Notes/Sources
- Private Canadian Apartments = MSCI/REALPAC Canada Quarterly Property Fund Index-Residential/MSCI Real Estate Analytics Portal – Accessed January 30, 2025.
- Public Canadian Preferred Shares = S&P/TSX Capped REIT Total Return Index/Bloomberg – Accessed January 30, 2025.
- Canadian Commercial Real Estate = MSCI/REALPAC Canada Quarterly Property Fund Index – All Properties/ MSCI Real Estate Analytics Portal – Accessed January 30, 2025.
- Canadian Bonds = FTSE Canadian Universe Bond Index/ www.blackrock.ca – Accessed January 30, 2025.
- Canadian Equities = S&P/TSX Composite Total Return Index / Bloomberg – Accessed January 30, 2025.
- US Equities = MSCI US Index / Bloomberg – Accessed January 30, 2025.
- Global Equities = MSCI MSCI World Index / MSCI Inc., www.msci.com/end-of-day-data-search – Accessed January 30, 2025.
- Emerging Market Equities = MSCI Emerging Market Index / MSCI In., www.msci.com/end-of-day-data-search – Accessed January 30,2025.


